Understanding precision farming metrics and how you can benefit from them
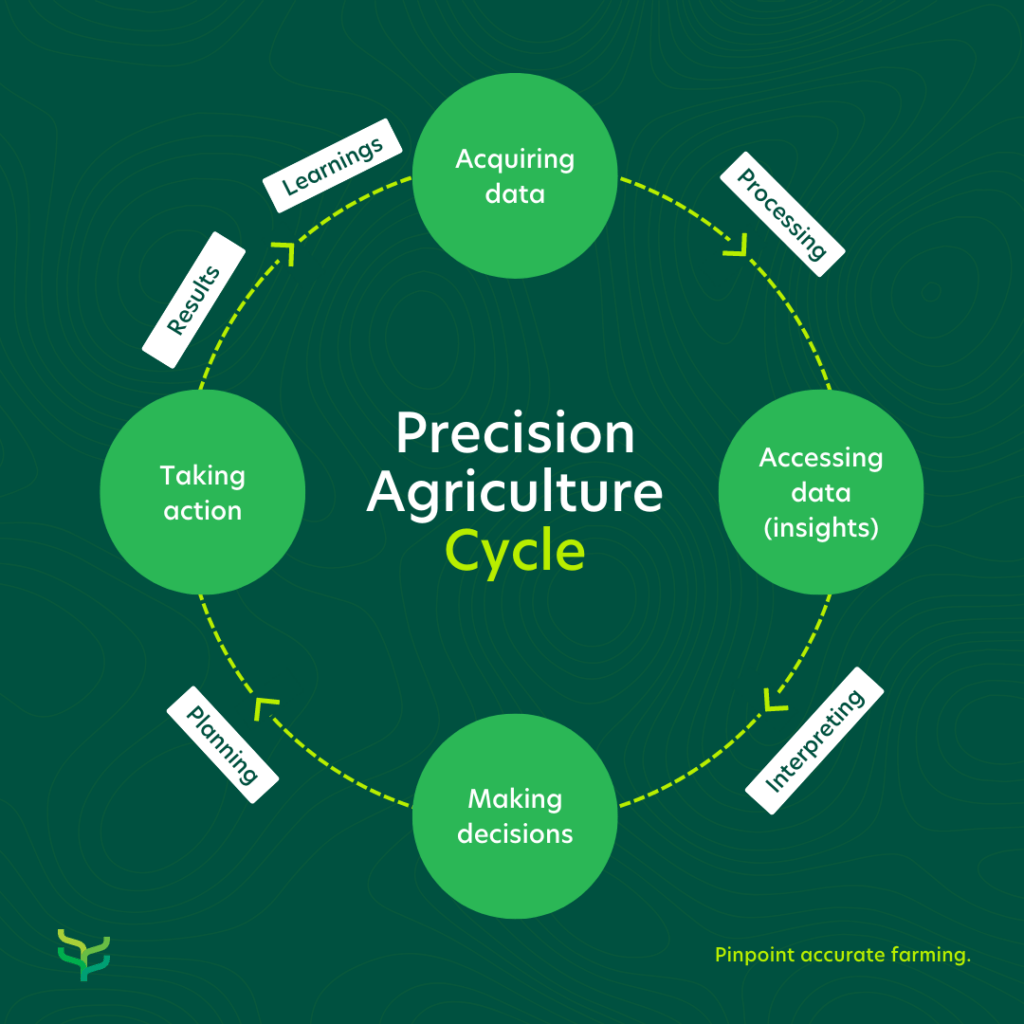
In this blog post, we’ll focus on the 1st phase of this cycle by answering the following questions:
The agricultural landscape has significantly expanded and changed over the last 50 years. One of the world’s oldest industries must embrace and utilise technological innovation if it wants to flourish despite the pressures it currently faces and will face in the future. Traditional farming methods are simply insufficient to yield enough produce to keep up with the rise in global food demand. Combined with environmental pressures like climate change, soil degradation and water scarcity, growers and producers are forced to explore innovative ways to manage their production. Precision Agriculture was initially theorised in the 1980s by Dr Pierre Robert, a pioneer in the field of precision farming principles. The idea was to use technology and equipment to spend resources where it is the most necessary in the field. With the rise of modern computer technology, precision farming became more exact and could be rolled out on a bigger scale and applied to bigger farms.
The International Society of Precision Agriculture has the following definition: “Precision Agriculture is a management strategy that gathers, processes and analyses temporal, spatial and individual data and combines it with other information to support management decisions according to estimated variability for improved resource use efficiency, productivity, quality, profitability and sustainability of agricultural production.”
Curious about precision farming? Download this FREE guide here
“Precision farming, or smart farming, is the practice of using data to optimise agricultural production, despite variable circumstances. It is a way of farming where every specific crop gets the right treatment, at the right time and in the right place. To do that, you need to know the precise details of your crops and fields.” – Jits Riepma, Agricultural Data Analyst
Precision Agriculture works in a cycle and can be broken down into four stages:

In this blog, we’ll focus on the 1st phase of this cycle by answering the following questions:
- What exactly does data acquisition entail?
- What methods and ways to collect data are used in this phase?
- What data should you collect, and how can you practically use those variables to benefit your operation?
1. What exactly does data acquisition entail?
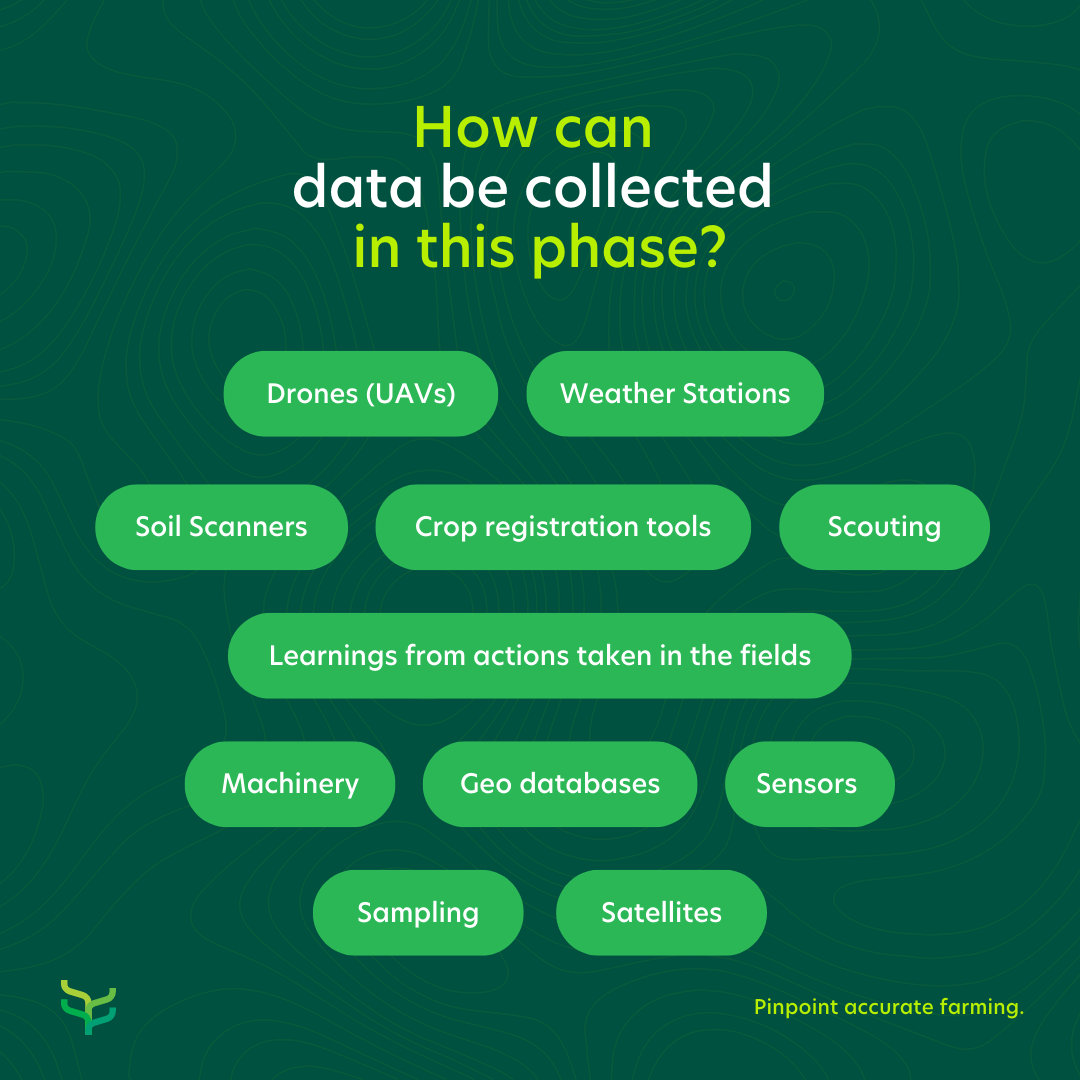
Every inch of your field is rich in meaningful data. The first step to understanding your fields is collecting local, reliable information. The data acquisition phase entails gathering as much data as possible about your crops, soil, fields, terrain, climate, variables and resource availability. Traditional data acquisition methods include visual observations like scouting and sampling, and technology increases the amount and frequency of observations through different sensors, satellites and other equipment. Data acquisition also entails using what you’ve learned from actions taken in the field as new inputs.
More data from different sources and locations ultimately leads to a more detailed overview of your fields and crops. High data density presents more accurate insights for more informed decisions and precise actions.
2. What methods and ways to collect data are used in this phase?
Farmers have been collecting and recording data for centuries – The first and oldest method of data collection was simply visual observations (or scouting). Technological innovation means more and more tools are available for data collection. New and traditional methods are employed to get complete field and crop data from various sources:
3. What data should you collect, and how can you practically use the variables to benefit your operation?
Various parameters can be measured, and understanding what those measurements mean(and how to use them) is the foundation of a successful smart farming operation.
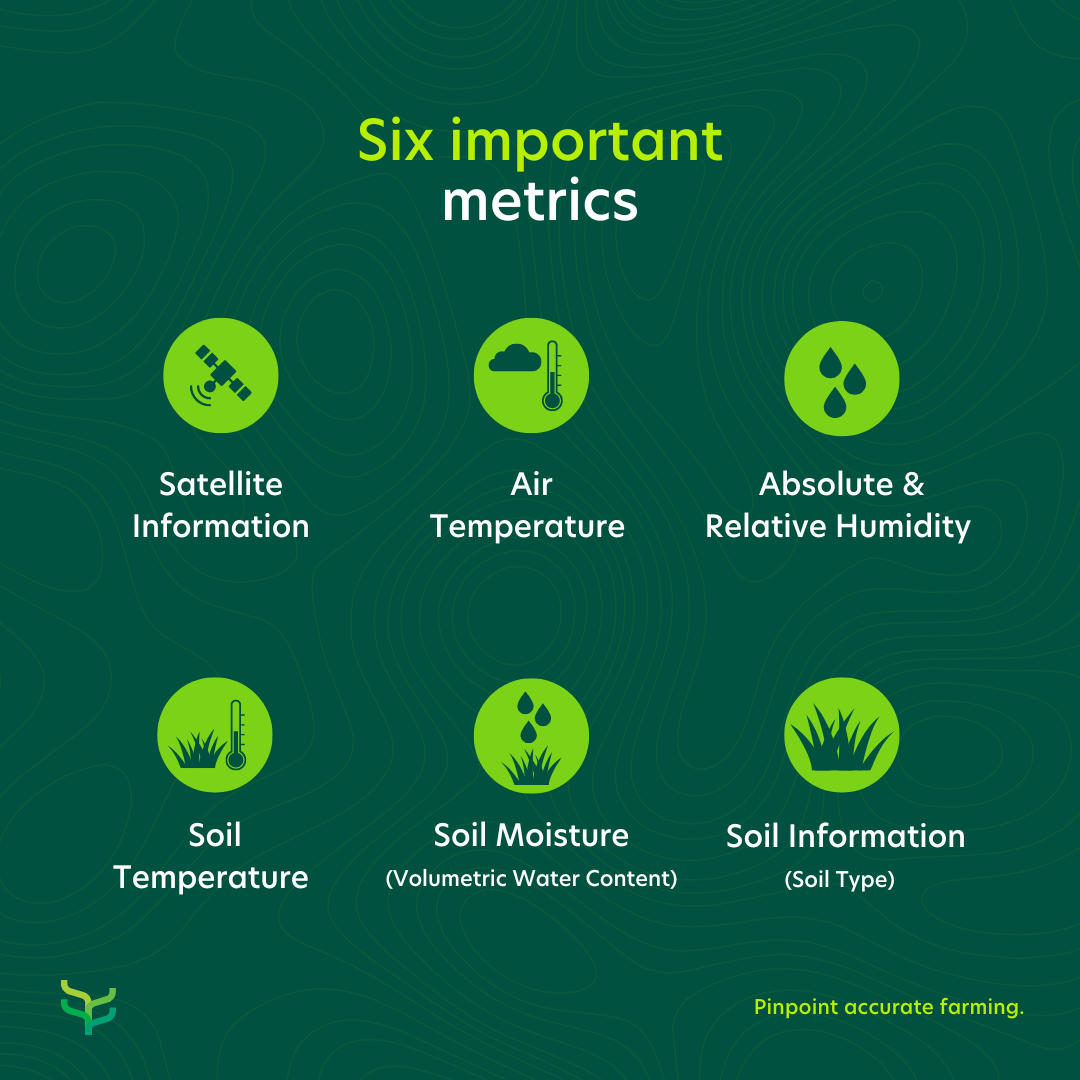
There are many more, but we’ll look at six important metrics gathered in the data acquisition phase and find out how they can be used:
Soil Information (acquired from various sources like satellites, sensors and sampling)
Gathering and maintaining updated information regarding your farm’s soil is crucial to the data acquisition phase. Many other metrics are calculated from or based on this information. Starting with soil type, soil classification essentially helps farmers plan what to grow and where to grow it. Soil type definitions are commonly based on the dominating size of the constituent particles, namely sand, clay, silt, peat, chalk and loam – or a combination of these. The smaller the particles, the less air between them, and the closer they stick to each other.
This, in turn, affects the nutrient and water-holding capacity of the soil. For instance, the smallest particles are characteristic of clay, known for excellent water-holding ability. Sand, on the other hand, consists of bigger particles that don’t stick together and has poor water retention capabilities. Note that ‘pure’ types are seldom met – you likely have to deal with mixtures like sandy clay, silty clay, loamy clay, silty loam, loamy sand, etc.
Agricultural software (including satellites and sensors) and soil maps are the most precise methods to gather and interpret data that accurately represent which soils actually make up your field. Different types of soil emit different signals (or temperatures) that are distinguished and recorded by satellites. Special software available at agricultural platforms interprets the signal and gives you high-precision results. Aside from soil type, a detailed soil map can show you the following:
Composition of the soil – The exact elements that make up the soil to understand which crops will be best suited
pH and conductivity – This is fundamental for determining the fertilisers and other nutrients that should be applied
Fertility – Knowing fertility can help growers make decisions to optimise their resources
Texture – Plays an essential role in nutrient management since it influences nutrient retention.
Soil Moisture – Volumetric Water Content (acquired from sensors)
This refers to the volume of water per unit volume of soil and is measured as a percentage:
Volumetric soil water content (%) = [volume of water (cm3)/volume of soil (cm3)] × 100
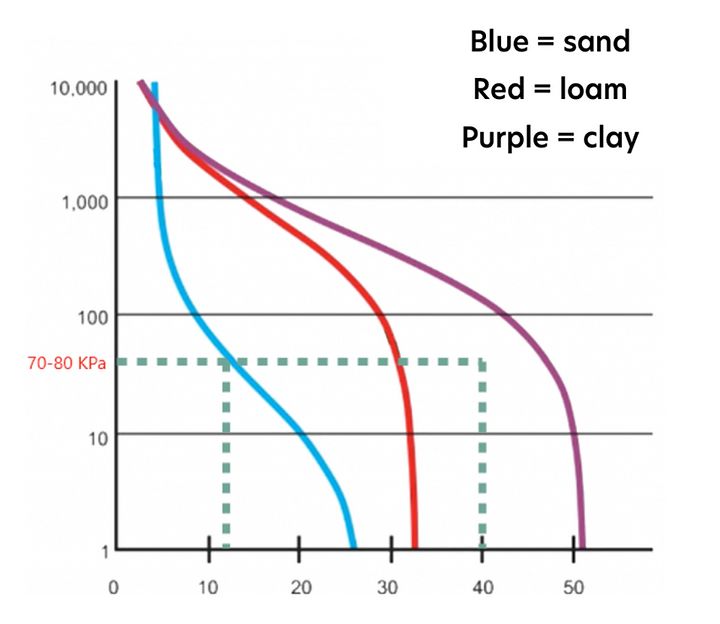
This is usually measured by soil sensors and gives the values at different depths. It’s essential to determine if crops are experiencing water stress and opens up the opportunity to take proactive action. It can be used to calculate when and how much to irrigate, leading to water-saving benefits. A soil moisture retention (or pF) curve is used to help determine the accurate irrigation requirements of your fields. For a specific soil type and crop type, it can indicate at which volume percentage you need to irrigate to avoid detrimental crop stress and how much you need to irrigate to give the optimum amount of soil moisture.
Smart farming tools allow growers to work with exact values for which they can set thresholds and receive notifications.
For example, this apple grower acquired data from soil sensors that measured moisture values at – 30cm. In this case, soil tension needs to be kept around 70-80 KPa for optimal fruit growth. He calculated this to be 11% volumetric water content in sandy soil and 40% volumetric water content in loam clay soil. The insights gained by processing the initial data collected enabled him to set soil moisture thresholds, which he used to optimise his irrigation regime. This, in turn, leads to water savings and a higher yield.
Soil Temperature (acquired from sensors)
Soil temperature (°F or °C) measured by sensors can optimise your operation by helping to determine the best possible time for sowing. Planting at the optimal temperature (crop and soil type dependant) helps to ensure the best crop emergence due to its importance for seed germination.
For example, when planting potatoes, there is a rule of thumb that soil temperatures at seed depth should be above 7°C and climbing (yet below 30°C) before starting to plant. This temperature threshold is especially important for cutting seed potatoes. When the seed is cut, the exposed surface area that requires healing is larger. Soil temperatures below 7°C stunts sufficient healing and greatly delays emergence. For example, Russet Burbank plants may emerge in 20 to 25 days at 10°C but can take more than 40 days at 7.2°C. Seeding into cold soils can cause seeds to remain dormant and become more vulnerable to soil pathogens, diseases, and predators.
Soil temperature can be a key indicator of when you should stop applying herbicides. The roots shut down at temperatures above 33 °C and stunt herbicide uptake. This insight aids in limiting chemical wastage and unnecessary run-off.
Absolute and Relative Humidity (acquired from sensors)
Absolute humidity (measured in grams of water vapour per cubic meter air volume) refers to the actual amount of water vapour in the air, regardless of the air’s temperature. Relative humidity (expressed as a percentage) measures the amount of water vapour that air is holding compared to the amount it can hold at a specific temperature.
Let’s focus on relative humidity: These values can give insights into the precise application of plant protection products. Spraying at the correct temperature and relative humidity enhances the effectiveness of the plant protection products – Most work better when it’s warmer since the chemical processes in the crops work faster. However, higher temperatures also make the chemical components of these products decrease faster and thus the working time is less.
The optimum values differ per product, but generally, a good temperature at which to spray is around 20°C. Relative humidity should not be too high, since it limits evaporation and with that, the uptake and transport of products within the crop. It is also recommended not to spray when relative humidity is less than 40%. This reduces the chance of drift due to temperature inversions or evaporation.
Relative humidity is an indicator of leaf wetness (simply the presence of water on a crop’s surface). Although this sounds harmless, it is precisely what some microorganisms need to go from innocent to crop-destroying pathogens. By monitoring leaf wetness, growers and their advisors can take proactive measures to protect their crops from diseases before there’s damage.
For example, Alternaria leaf spot and head rot on broccoli are commonly caused by a couple of fungi: Alternaria brassicicola and Alternaria brassicae. Disease development is favoured by cool temperatures and long periods (more than 9 hours) of high moisture. These metrics can help growers and advisors prepare in case of prolonged periods of high moisture in the air and avoid the damage caused by the fungi.
Satellite Information (acquired from satellites)
Satellite information allows growers, researchers and crop advisors to see a complete picture of their fields. Remote sensing satellites provide key data for monitoring soil, snow cover, drought and crop development. Growers and crop advisors can now compare fields, make predictions based on biomass increase and clearly see in which areas crops are experiencing stress. This technology also provides up-to-date information on moisture stress, disease, structural anomalies, and nutrient levels. Modern precision agriculture satellite imagery has a high spectral resolution, allowing growers to get pinpoint accurate data.
Practically, you can track field vegetation using the NDVI index and find problem areas. Simply put, NDVI (Normalised Difference Vegetation Index) is an indicator of a plant’s health based on how a plant reflects different light waves – Chlorophyll (a health indicator pigment) strongly reflects near-infrared light, while dehydrated, sick, or diseased plant absorbs more of the near-infrared light.
Access to constant, up-to-date NDVI maps helps farmers and crop advisors with the early detection of problem areas. Many Precision Agriculture platforms use NDVI to guide crop scouts in the field and improve the precision of fertiliser application, plant protection products and irrigation. The combination of scouting with satellite remote sensing is most effective in helping determine deviations from the norm.
Satellite imagery can also be used for planning plant treatments and selecting agricultural chemicals. To find out how you can prevent potential crop damage and preserve revenue with satellite data, access the use case from Planet (the leading provider of global daily earth data), here.
Air Temperature (acquired from sensors or weather stations)
Accurate information regarding air temperature can help with the precise application of plant protection products. Certain pests become active at specific temperatures; farmers can implement preventative measures to minimise the damage. Air temperature can also help determine crop transpiration and soil evaporation, guiding a targeted irrigation regime.
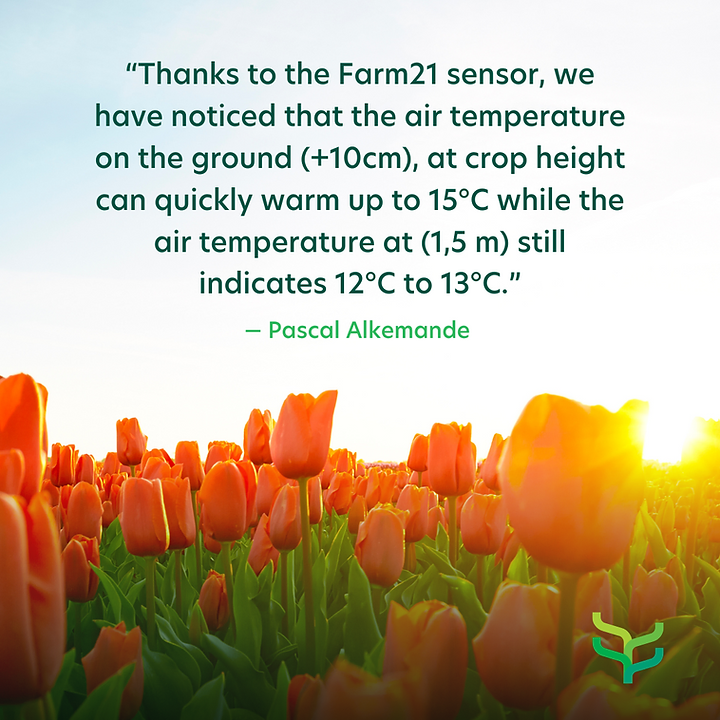
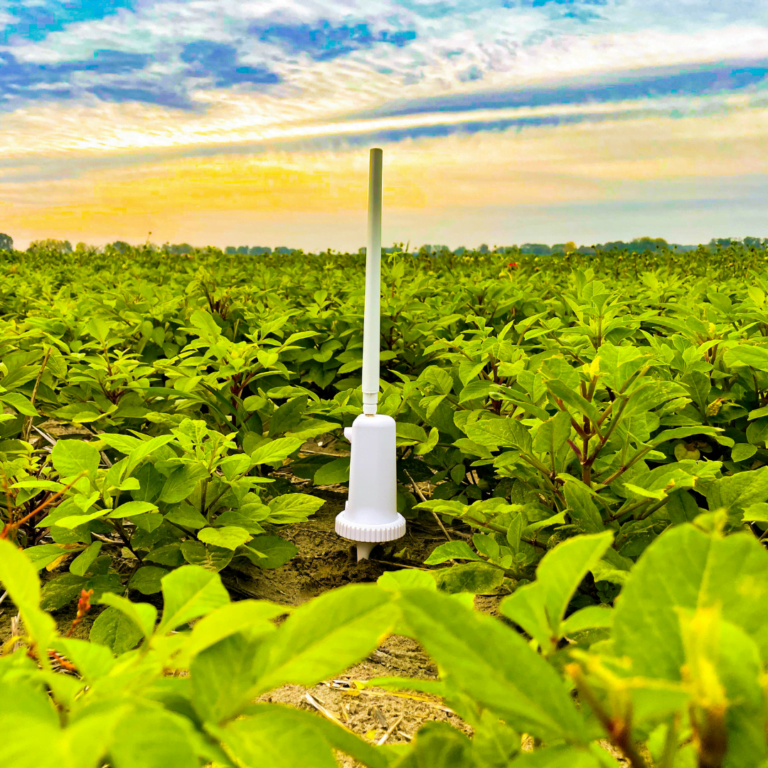
For example, this flower grower from Breezand, North Holland, noticed that the air temperature on the ground (+10cm at crop height) can quickly warm up to 15°C while the air temperature at 1,5 m still indicates 12°C to 13°C. For Pascal, it is very important to measure ground temperature with absolute precision as diseases that affect tulips are spread by lice, and lice thrive at a temperature of 15°C.In this case, when weather applications measured 12°C, the Farm21 sensor measured the exact temperature, and the farmer could take the necessary action that prevented the lice from harming the tulips.
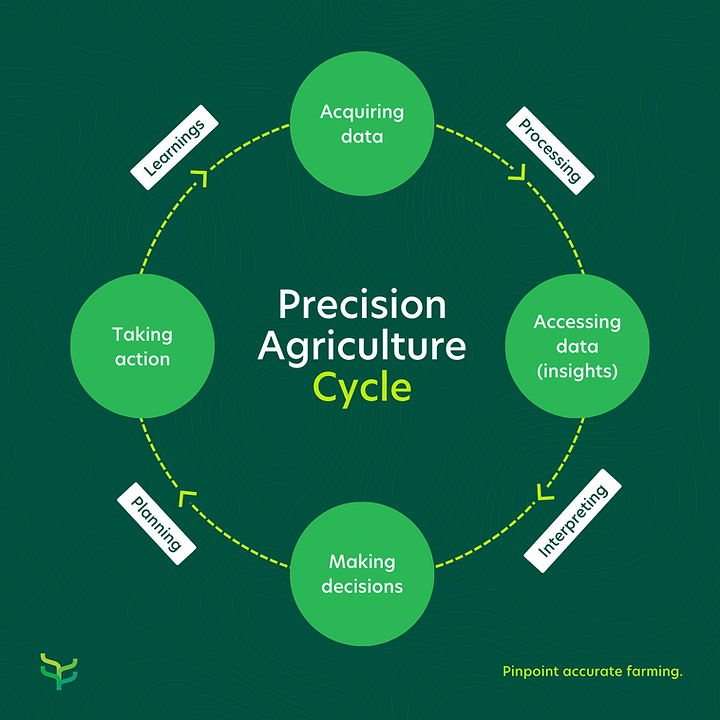
Precision Agriculture Cycle Phases
Let’s briefly touch on the remaining 3 phases of the precision farming cycle and trace the journey from initially acquiring the data to using the feedback as new data inputs and learnings.
Phase 2: Accessing the data
To unlock the value from the metrics in phase one, it needs to be turned into insights. Data acquired is processed and can be accessed through GIS, geostatistics, data analysis and programming. Precise weather data, for instance, can help farmers plan better – when to irrigate, spray, sow, or harvest is often hugely weather dependent. Interpreting information from weather applications has been a vital tool in developing Precision Agriculture.
Another excellent way to access information is through digital platforms that bring information from various sources together in one place. Growers, crop advisors and researchers can effortlessly access sensor, satellite, weather and scouting data. Farm21 developed a platform that integrates different sources to generate combined insights. This enables users to see trends, and correlations and helps to evaluate risks. Consistent and up-to-date access to data from sensors, soil, crops, weather, and satellites, means that never have to guess about variables.
Once information is accessed and interpreted, you can move to the next phase to make data-driven decisions.
Phase 3: Making fact-based decisions
This is where the hard work of the previous two stages starts to pay off. This is where data inputs are translated into informed decisions. The data you’ve gathered and interpreted becomes the foundation of smart decisions. The combination of knowledge and experience backed with hard facts brings new opportunities to the table – Growers and advisors no longer have to guess. Better decisions regarding irrigation, fertilising, disease control, crop protection application, harvesting, and sowing can be made when you know the accurate details of your fields and crops. One of the major benefits of basing decisions on facts is the efficient use of resources.
Let’s look at the apple grower from section A – As mentioned, he calculated that the volumetric water content should be 11% in sandy soil and 40% in clay soil for optimum fruit growth. He then used data inputs from soil sensors to guide his decisions on when and how much to irrigate in order to keep the soil moisture levels within these parameters. These decisions, in turn, led to actions that saved water and increased his yield. He also built on what he learned as new data inputs for the next season, essentially completing the Precision Farming cycle.
Phase 4: Taking Action
Building on the decision-making process of the previous stage, it’s time to take the relevant actions. Sufficient planning with a focussed approach means farmers can employ resources with pinpoint accuracy.
The cycle continues as feedback from the previous three phases becomes a new source of data acquisition through learning. Another valuable source of new data in the acquisition phase is the output of the actions, which can be new data again. Simply put, by observing the results and effects of certain actions in the field, growers, advisors, and researchers can use it as a new source of information for data acquisition.
An example of a Precision Agriculture tool that comes into play in this phase is VRA or Variable Rate Application. As the name suggests, this allows farmers to apply fertilisers, plant protection products, seeds and water at different rates. There are two types of VRA: map-based and sensor-based. Map-based VRA adjusts your product application based on a pre-generated map of your field. Sensor-based VRT doesn’t use a map, but rather mounted sensors that measure soil properties or crop characteristics in real-time. The control system then calculates the number of inputs that are required.
In summary, Precision Agriculture consists of performing the right operation, in the right place, at the right time, in the appropriate manner and the right amount. To achieve this, you must start with gathering accurate data and translate this into valuable insights on which to base your decisions.
These decisions lead to specific in-field actions that result in synergistic benefits for your whole operation.
Understanding the precision farming metrics is valuable in the journey towards smart farming.
Find out more by viewing the webinar recordings where Farm21 experts answered these and other questions about precision farming metrics >> Click here to view.
✓ How does accurate field data help optimise your farming operation?
✓ What can you measure, and what do these metrics actually mean?
✓ How can fact-based decisions impact your resource usage?
✓ What role do precision farming metrics play in going from reactive to proactive farming?

