Satellite data – all you need to know about Farm21’s new feature
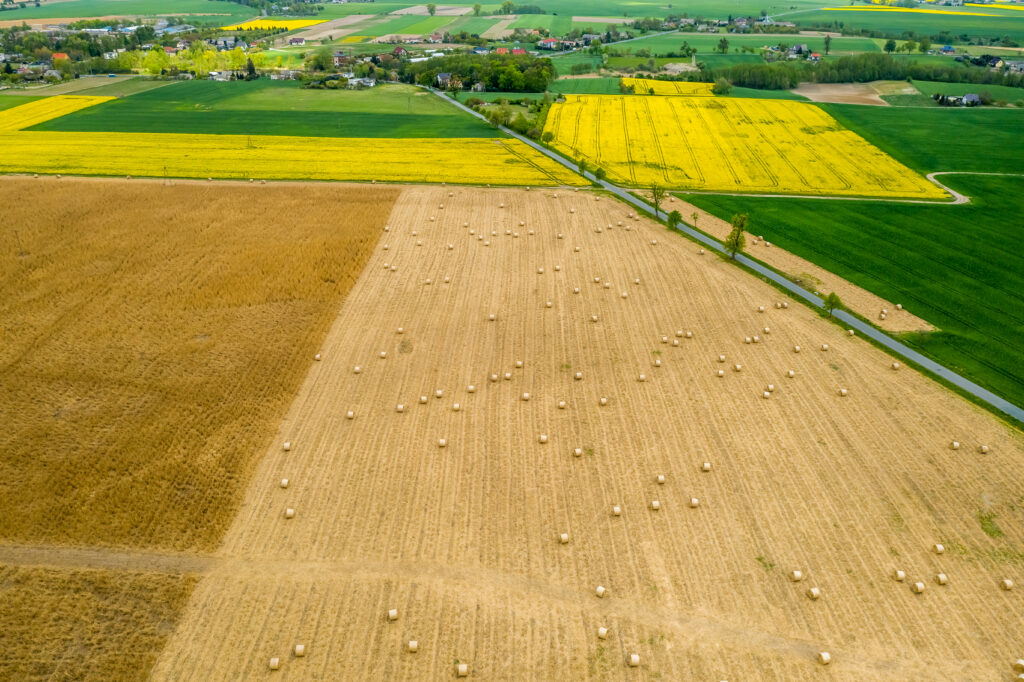
In this blog, we’ll talk about the benefits of smart farming tools and where satellite data fits in. We’ll highlight valuable satellite imagery applications and discuss the following types of satellite data in more detail:
- NDVI – Normalised Difference Vegetation Index
- WDVI – Weighted Difference Vegetation Index
- NDRE – Normalised Difference Red Edge Index
- NDMI – Normalised Difference Moisture Index
One of the significant advances in precision farming happened in the 1970s when satellite imagery was used in agriculture to collect field data. Suddenly, farmers could view large and remote areas to get a sense of what was truly happening in their fields. Fifty years ago, when scientists calculated the NDVI (Normalised Difference Vegetation Index), it was considered one of the most successful attempts to simply and quickly identify vegetated areas and their conditions. This has subsequently improved the capacity and abilities of agricultural researchers, agronomists and growers to make fact-based decisions.
Fast forward to the present, and today there is a wide range of satellite data available to relay different information regarding fields and crops. This, together with the improved resolution of these images, means fields and crops can be monitored better than ever.
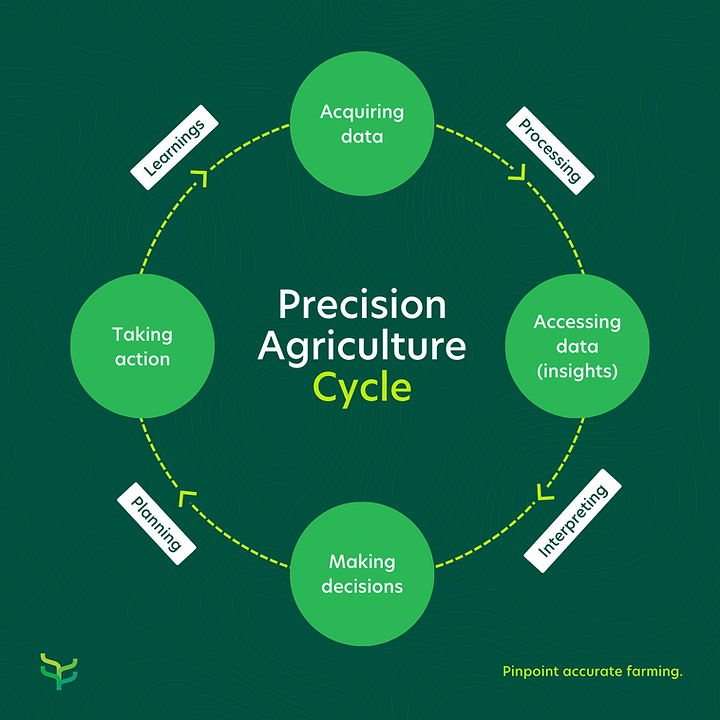
Implementing smart farming methods holds multiple benefits for farmers in terms of sustainability and profitability. (To find out more about the benefits of precision farming, read here). Collecting data is the first step in the precision farming cycle, and using satellites is an excellent data collection method. It adds a spatial layer over the precise measurements collected from, for example, sensors for a more comprehensive overview of what is happening in your fields.
Remote sensing satellites can be used to determine valuable insights relating to water stress, disease, structural anomalies, as well as nutrient levels. Modern precision agriculture satellite imagery also has a high spectral resolution, giving users a crystal clear view of their fields.
Satellite Data Applications:
Monitor Crops
Use remote sensing data to monitor risk factors and take proactive measures that will ensure crop health
Analyse Fields
Extract insights from satellite images to apply the right resources at the right time, in the right amount
Increase Yield
Assess information like soil moisture, temperature and crop condition to make better decisions to maximise yield
We’ll explore the following four types of satellite imagery and their uses:
1. NDVI – Normalised Difference Vegetation Index
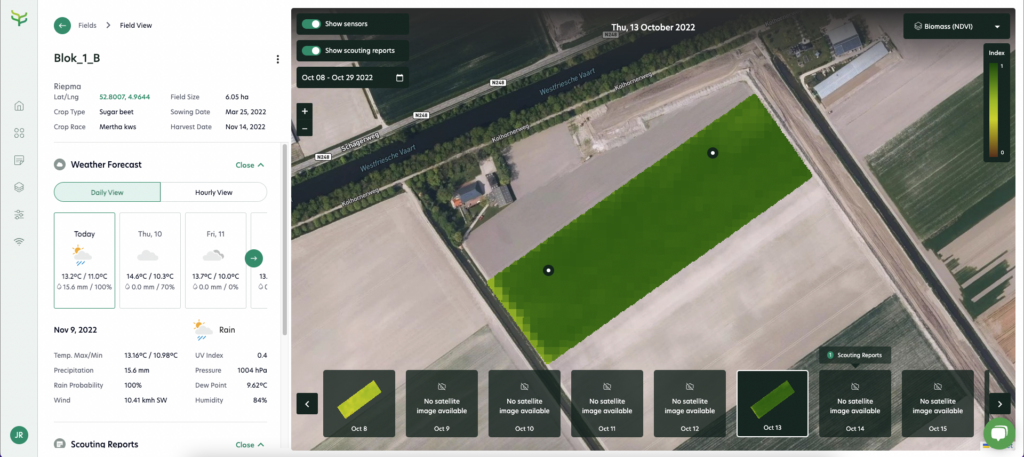
NDVI is an indicator of photosynthetically active biomass. Simply put, it is a calculation of vegetation health, based on how different light waves are reflected. The chlorophyll pigment in plants reflects green waves and absorbs red waves, and cell structures in plants reflect the near-infrared (NIR) waves. When photosynthesis occurs, the plant grows and contains more cell structures. Where healthy plants (containing chlorophyll and cell structures) absorb red light and reflect NIR, unhealthy plants will do the opposite. This relationship between light and chlorophyll is how we can use NDVI to distinguish a healthy plant from a diseased one.
This is, of course, very useful to monitor fields and see where there are possible risk areas. Water stress, diseases and pests are among the many factors affecting plant health. Although NDVI is not used to diagnose a particular condition, it tells farmers and farm managers where to direct their attention. NDVI values also indicate where the crop is in its growth cycle, prompting specific relevant in-field actions.
Usually, NDVI results are presented as a colour map, where each colour corresponds to a certain range of values. There’s no standard colour palette, but the Farm21 uses a “brown-yellow-green” palette, meaning that brown-yellow tints indicate bare soil or dead (or sparse) vegetation, and all shades of green are a sign of normal to dense vegetation cover.

For example, the image above shows the NDVI during the tulip growing season. It indicates a rapid increase in biomass in April, which leads to flower development. The optimum flowering period can clearly be seen through the dip in the index (note that the satellites ‘see’ yellow when this happens). After the flowers are cut, green leaves appear again, and the biomass index rises steeply. From this time, the bulbs will start growing and ripening until they are ready for harvest. This data provides valuable information about the period with a high biomass increase, the start of the flowering period, the length of the flowering period, and the time after cutting.
2. WDVI – Weighted Difference Vegetation Index
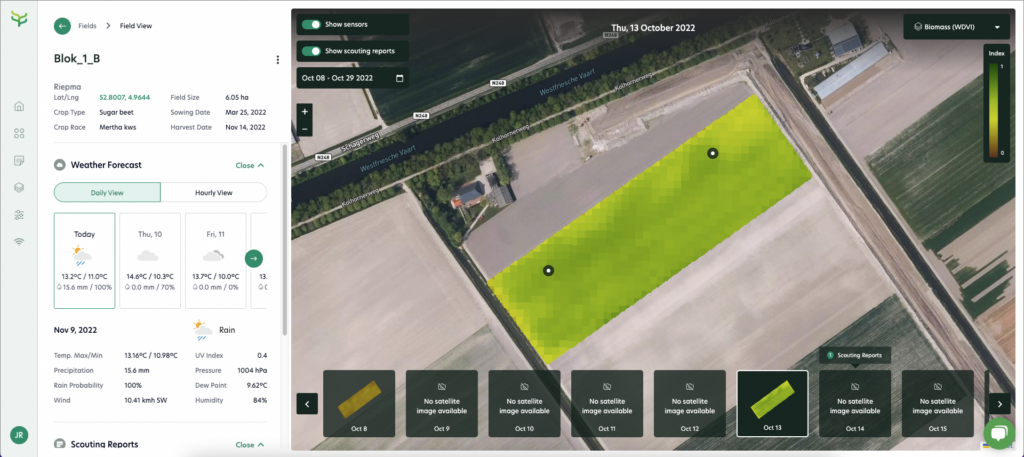
This works similarly to NDVI by indicating how healthy crops are or where in the growth cycle they are based on how different light waves are reflected. Again, healthy vegetation with a lot of chlorophyll reflects more NIR and green light and absorbs more red and blue light. It provides an overview of large areas and shows discrepancies in clusters rather than individual plants.
Compared to NDVI, WDVI provides valuable data later in the growing season as it can be used to estimate leaf area index (LAI) and offers a good correction for soil background.
Where NDVI is completely saturated at 1 (the highest index) when the field is filled with biomass, the WDVI can still measure more. Therefore, it can also distinguish between one layer of leaves (LAI=1) and multiple layers of leaves and can be used to determine the LAI. LAI is the projected area of green leaves per unit of land. It’s helpful to monitor the distribution of and changes in vegetation. It is an excellent way to assess crops’ growth and subsequent health. It can also indicate canopy health and give valuable information on the microclimate later in the season.
3. NDRE – Normalised Difference Red Edge Index
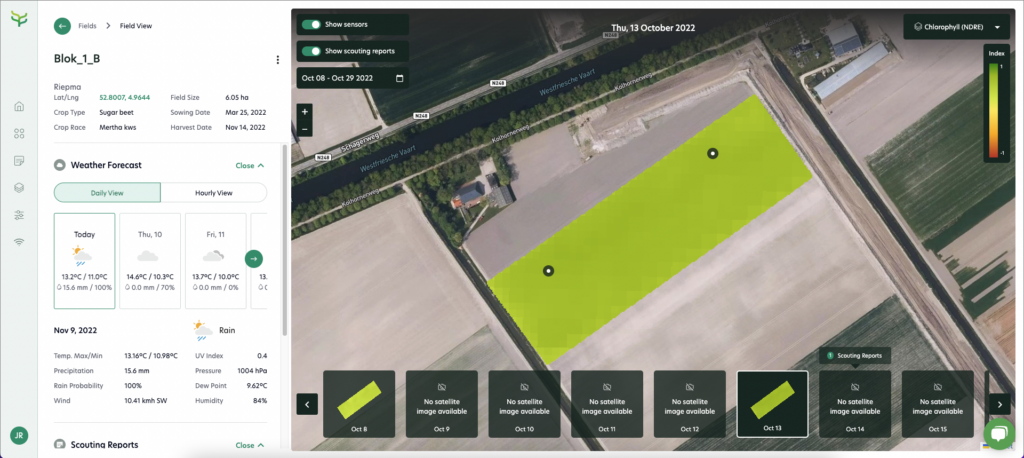
NDRE is another way of indicating plant health by monitoring chlorophyll content. It is calculated using a combination of NIR light and a frequency band that sits on the transition region between visual red and NIR light — hence the name “red edge”.
NDRE can measure further into the canopy as it is not as strongly absorbed by only the top layers of leaves and can thus give better insight into permanent or later-stage crops. It provides valuable data for proactive decision-making since NDRE can detect changes that are not visible to the naked eye yet, and confirm whether a growing plant is healthy or not. Low amounts of chlorophyll may indicate the problem crops:
- Disease
- Pest infestation
- Nutrient deficiencies
- Damage
NDRE will point users to the problem crop to further investigate the cause of the low chlorophyll content and take preventative action.
4. NDMI – Normalised Difference Moisture Index
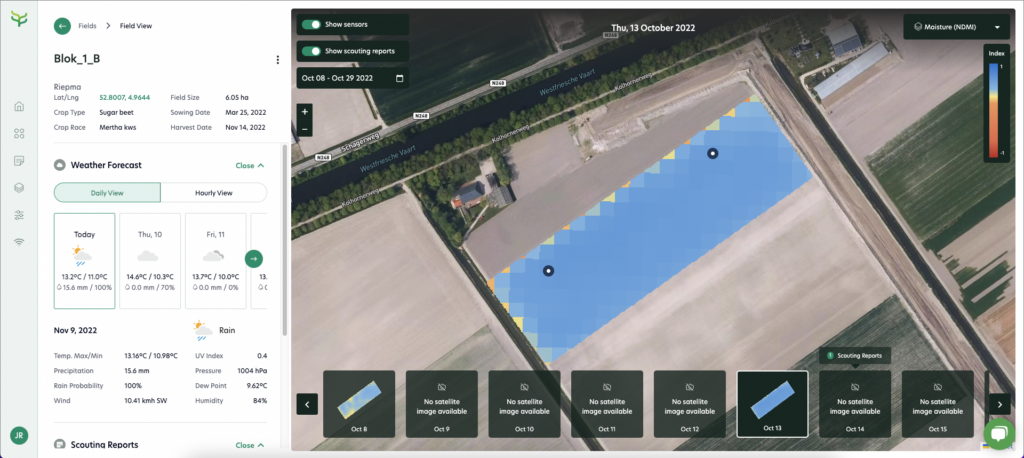
NDMI detects moisture levels in plants by using a combination of NIR and short-wave infrared (SWIR) spectral bands. It gives users a reliable indication of water stress in crops.
It is important to remember that NDMI values vary throughout the growing season. This is due to the plants’ reflectance being slightly different for every phenological stage. This index indicates crop moisture levels using a relative scale from -1 to 1 and every value in between will correspond to a slightly different agronomic situation (where negative values approaching -1 usually indicate water stress).
Still, it does not show the actual moisture content of the crops, meaning users will only know that one area of the field has a higher or lower water content than the rest. Since crops within the same field vary, there won’t be a value of 1 for the whole field. Combining this index with data gathered by the FS21 soil sensors makes it possible to correlate the indexes with localised soil moisture readings. This means we will have more accurate and reliable information regarding the potential moisture restrictions for specific areas in the field.
NDMI and NDVI also work well together – Water stress indicated by the NDMI values can be confirmed by a significantly lower than average NDVI.
At Farm21, our team is constantly working to give our users more and better information, in order to make the best data-driven decisions that will result in real benefits. We want to be the precision farming partner that helps growers, researchers, distributors and crop advisors to truly optimise their operation.
Our current free plan includes:
- Scouting app
- Cultivation plans and field boundaries
- Weather data
- Data Sharing
- Unlimited users and data storage
PLUS, we’ve added satellite data which includes four types of satellite imagery.
- NDVI – Normalised Difference Vegetation Index
- WDVI – Weighted difference vegetation index
- NDRE – Normalised Difference Red Edge Index
- NDMI – Normalised Difference Moisture Index
Users can receive 10x10m resolution satellite images every 4-5 days, depending on the satellite location and the day’s cloud cover.
A year’s worth of historical data from satellites for existing fields will be available.
New fields will also be generating historical data as they are made (or boundaries are added to existing fields that did not have boundaries).
Our updated fields page allows users to have better control with information from satellite data as well as scouting reports organised by days.
Create an account to start your journey with us today! Get started for free

